
von Mitch Zacks
The Nobel laureate economist, Robert Shiller, recently penned an article in The New York Times warning, amongst other things, that market valuations (as measured by the CAPE ratio) were at levels not seen since 1929 and 1999. Market historians would note that 1929 and 1999 preceded weak decades for market returns, with the Great Depression on the one hand and the Tech Bubble and Great Recession on the other. With the start of a new decade in 2020 and the historically high CAPE ratio, it begs the question: are we in year one of a weak decade for stocks? First, an Understanding of How the CAPE Ratio Works
A good starting point for understanding the CAPE ratio is to think about the basic P/E ratio first. The P/E (price to earnings) ratio measures a stock’s price relative to its per-share earnings over the last year. It is a widely-accepted metric for valuation, but Shiller and fellow economist John Y. Campbell saw a problem with it. They recognized that a company’s earnings can be fairly volatile from year to year, and that earnings volatility is especially true during peak and trough years in a business cycle. So, to minimize the effect of short-term business cycle gyrations on the valuation measure, the two economists created a ratio where the stock price is divided by the company’s average earnings over the previous 10 years, instead of just a single year. This helps “smooth” out the number and allows for comparing valuations over a longer time horizon. A high CAPE ratio signals an overvalued market, and Shiller notes that the current CAPE ratio (31) has only been higher twice in history: 1929 and 1999. The S&P 500 fell some -85% through 1932 and -50% in the 2000 bear market. Ready to Run for the Exits? Not So Fast.
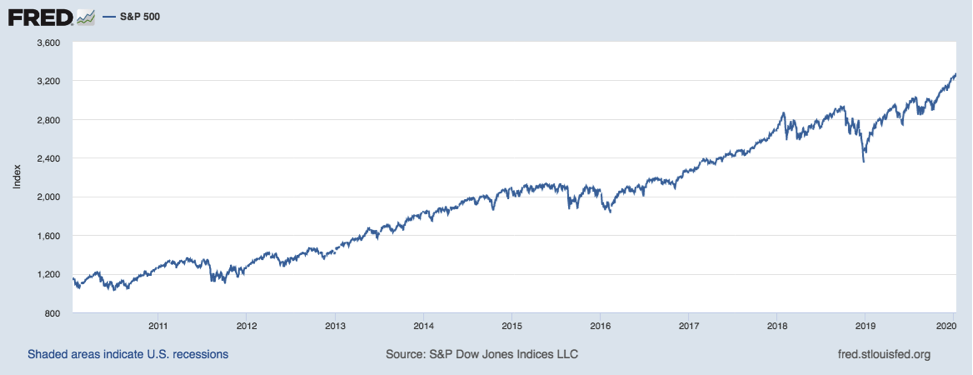
The CAPE ratio is a useful indicator and has plenty of merits. But in my view, making investment decisions based solely on CAPE ratio levels is flawed, if not outright wrong. For one, the CAPE ratio uses decade-old earnings data, which is great for historical comparisons but tells us virtually nothing about what lies ahead (which is exactly what we want to inform our investment decisions). Factors like falling energy prices, cheaper commodities, productivity gains, currency fluctuations, and powerful new technologies and innovations (just to name a few) are likely to contribute significantly – or conversely weigh down – a company’s future earnings, in my view. Remember, a stock’s price today is greatly influenced by what investors are willing to pay for expected earnings, meaning that sentiment, growth forecasts, innovation, and management play key roles. The CAPE ratio doesn’t account for any of these things. Another reason I believe investors should not rely only on CAPE ratios to make investment decisions: doing so would have likely meant missing out on big gains in this bull market. In 2013, The Wall Street Journal wrote of a “rising concern among some market watchers that stocks are being lifted by a potentially dangerous bubble, with Shiller’s index seen as one of the early warning signs.” In 2016, The Wall Street Journalpublished an article titled, “Stock Valuations Flash a Warning Sign” when the CAPE ratio rose above 27. In that article, readers were reminded that when the CAPE ratio reaches it top decile, the S&P 500 averages about 4% annually for the following ten years. Either of these articles – or the dozens of others that cited warning signs for the CAPE ratio over the last decade – could make a theoretically compelling case for investors to pare down equity exposure. But the chart below illustrates quite clearly why I believe it would not have made good investment sense to do so.
In Spite of CAPE Ratio Warnings, the S&P 500 has Continued to Climb Source: Federal Reserve Bank of St. Louis Bottom Line for Investors
Investors are constantly searching for ways to ‘value’ the market. Valuations help us determine when stocks are cheap and therefore attractive, or when they’re expensive and should be avoided. But valuations alone should not direct an investment strategy. If they did, and you relied on the CAPE metric as a proxy for when to invest in the last twenty years, you may have never owned equities! For a long-term growth investor, that would have been a mistake, in my view. If today we saw a confluence of negative economic data alongside a high and rising CAPE ratio, then we’d probably have something to fear. But we don’t think that’s the case at all. Global growth is expected to hit close to 3% in 2020, interest rates remain low globally, inflation is low and controlled in the U.S., the labor market is strong as ever, and corporate profits are expected to post strong growth following weak comparisons in 2019. The CAPE ratio may signal trouble in the decade ahead, but at the end of the day (and decade), I believe it is fundamentals, earnings, growth, and innovation that will determine the market outcome.
Wenn du keinen Beitrag mehr verpassen willst, dann bestell doch einfach den Newsletter! So wirst du jedes Mal informiert, wenn ein neuer Beitrag erscheint!
|